 Pinelab.studio
    # Install this plugin
    npm install @pinelab/vendure-plugin-metrics
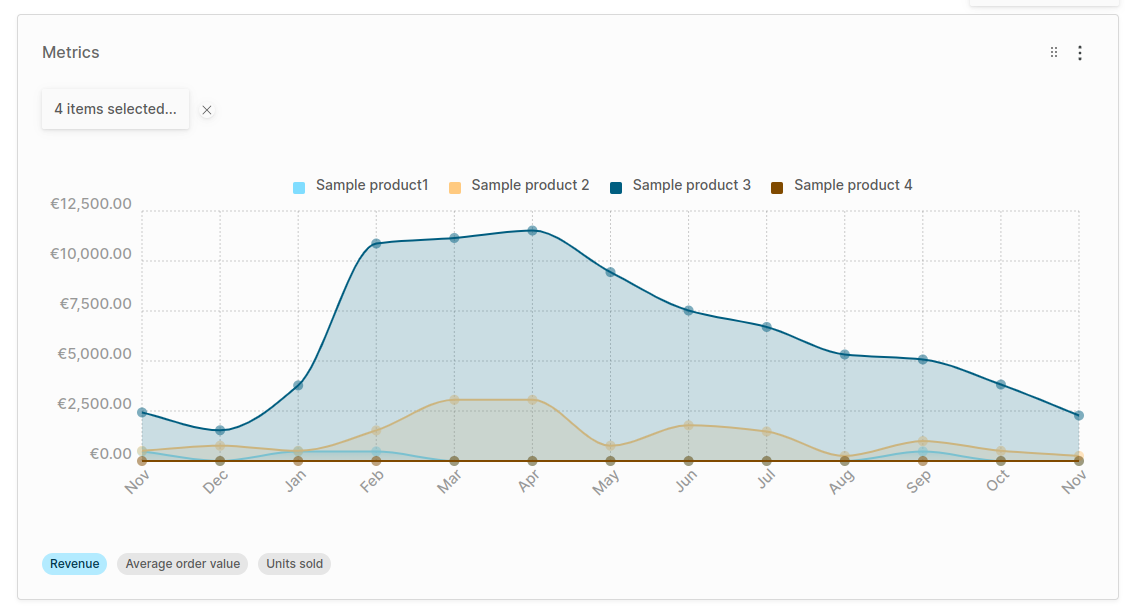
Vendure Metrics plugin
A plugin to visualize your shops most important metrics of the past year.
Getting started
- Configure the plugin in
vendure-config.ts:
import { MetricsPlugin } from "@pinelab/vendure-plugin-metrics";

plugins: [
  ...
    MetricsPlugin.init({
      // Consider displaying fewer months for shops with a lot of orders
      displayPastMonths: 13
    }),
    AdminUiPlugin.init({
      port: 3002,
      route: 'admin',
      app: compileUiExtensions({
        outputPath: path.join(__dirname, '__admin-ui'),
        extensions: [MetricsPlugin.ui],
      }),
    }),
  ...
]
- Rebuild your Admin UI
- Start your Vendure server and login as administrator
- You should now be able to add the widget
metricson your dashboard.
Metric results are cached in memory to prevent heavy database queries every time a user opens its dashboard.
Built-in Metrics
- Revenue (per product): The total revenue per month, or the revenue generated by specific variants if a variant is selected.
- Average Order Value (AOV): The average of
order.totalWithTaxof the orders per week/month - Units sold: The number of units sold for the selected variant(s).
Custom Metrics
You can implement the MetricStrategy interface and pass it to the MetricsPlugin.init() function to have your custom metric visible in the Widget.
// Fictional example that displays the average value per order line per month in a chart

import {
  Injector,
  OrderLine,
  ProductVariant,
  RequestContext,
  TransactionalConnection,
} from '@vendure/core';
import {
  MetricStrategy,
  NamedDatapoint,
  AdvancedMetricType,
} from '@pinelab/vendure-plugin-metrics';

export class AverageOrderLineValue implements MetricStrategy<OrderLine> {
  readonly metricType: AdvancedMetricType = AdvancedMetricType.Currency;
  readonly code = 'average-orderline-value';
  /**
   * Determines if this metric allows filtering by variants
   */
  readonly allowProductSelection = true;

  getTitle(ctx: RequestContext): string {
    return `Average Order Line Value`;
  }

  getSortableField(entity: OrderLine): Date {
    return entity.order.orderPlacedAt ?? entity.order.updatedAt;
  }

  // Here you fetch your order lines
  async loadEntities(
    ctx: RequestContext,
    injector: Injector,
    from: Date,
    to: Date,
    variants: ProductVariant[]
  ): Promise<OrderLine[]> {
    let skip = 0;
    const take = 1000;
    let hasMoreOrderLines = true;
    const lines: OrderLine[] = [];
    while (hasMoreOrderLines) {
      let query = injector
        .get(TransactionalConnection)
        .getRepository(ctx, OrderLine)
        .createQueryBuilder('orderLine')
        .leftJoin('orderLine.productVariant', 'productVariant')
        .addSelect(['productVariant.sku', 'productVariant.id'])
        .leftJoinAndSelect('orderLine.order', 'order')
        .leftJoin('order.channels', 'channel')
        .where(`channel.id=:channelId`, { channelId: ctx.channelId })
        .andWhere(`order.orderPlacedAt >= :from`, {
          from: from.toISOString(),
        })
        .andWhere(`order.orderPlacedAt <= :to`, {
          to: to.toISOString(),
        })
        .skip(skip)
        .take(take);
      if (variants.length) {
        query = query.andWhere(`productVariant.id IN(:...variantIds)`, {
          variantIds: variants.map((v) => v.id),
        });
      }
      const [items, totalItems] = await query.getManyAndCount();
      lines.push(...items);
      skip += items.length;
      if (lines.length >= totalItems) {
        hasMoreOrderLines = false;
      }
    }
    return lines;
  }

  // This is where you return the actual data points
  calculateDataPoints(
    ctx: RequestContext,
    lines: OrderLine[],
    // Variants are given when a user is filtering based on variants in the chart widget
    variants: ProductVariant[]
  ): NamedDatapoint[] {
    const legendLabel = variants.length
      ? `Order lines with ${variants.map((v) => v.name).join(', ')}`
      : 'Average order line value';
    if (!lines.length) {
      // Return 0 as average if no order lines
      return [
        {
          legendLabel,
          value: 0,
        },
      ];
    }
    const total = lines
      .map((l) => l.linePriceWithTax)
      .reduce((total, current) => total + current, 0);
    const average = Math.round(total / lines.length) / 100;
    return [
      {
        legendLabel,
        value: average,
      },
    ];
  }
}
Contributions
Thanks @dalyathan for his contributions on this plugin.